Plots group comparison of coefficient weights
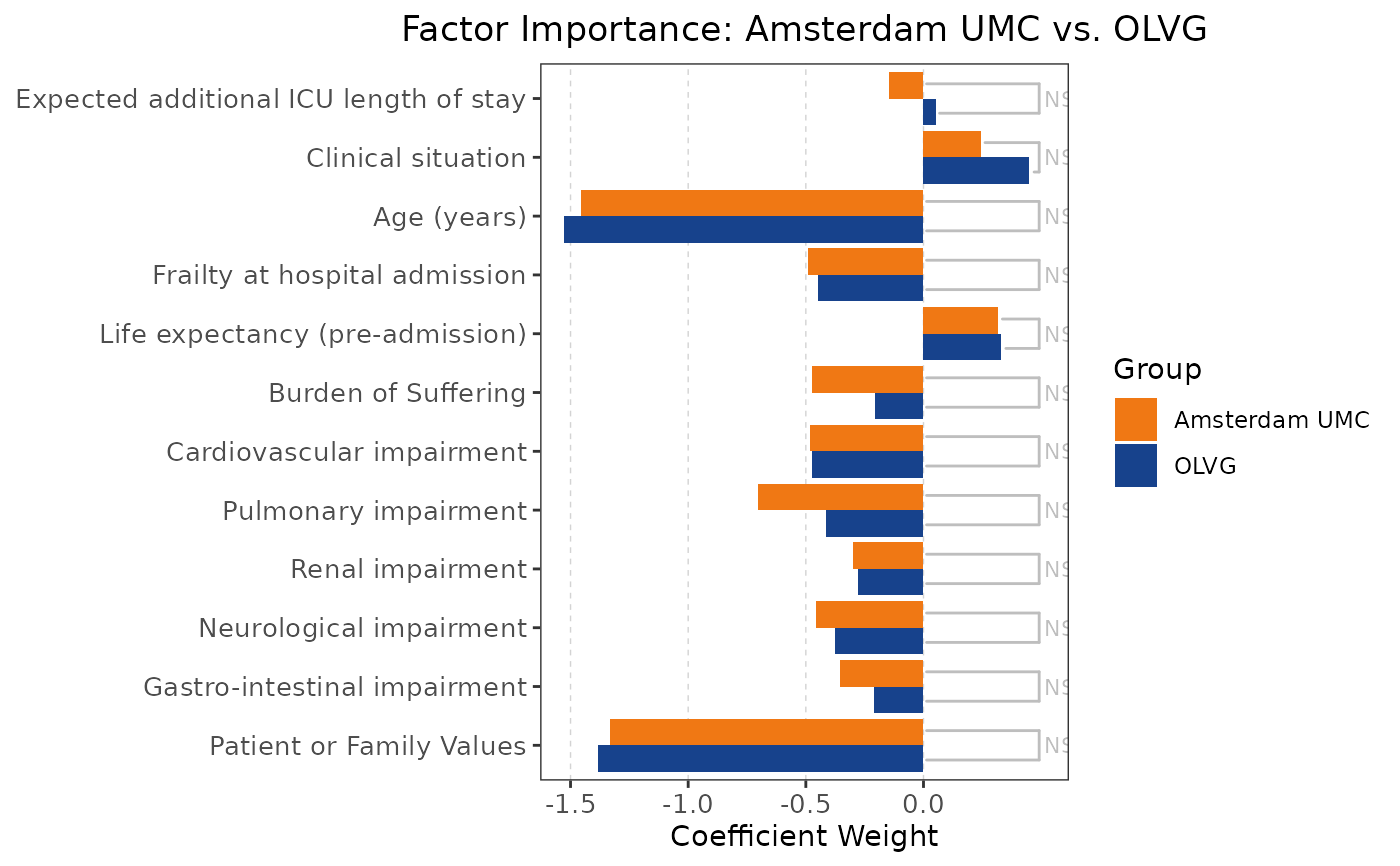
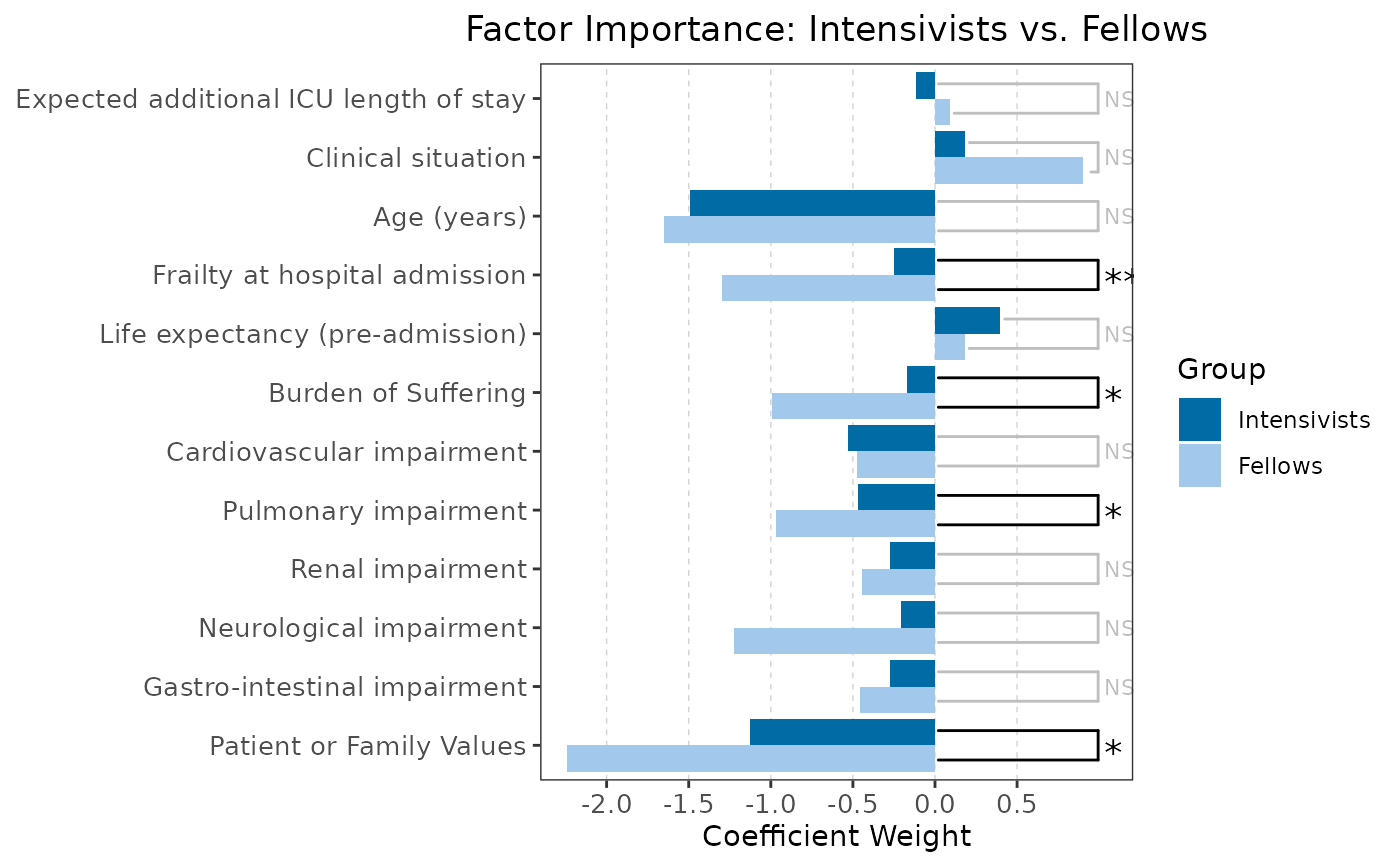
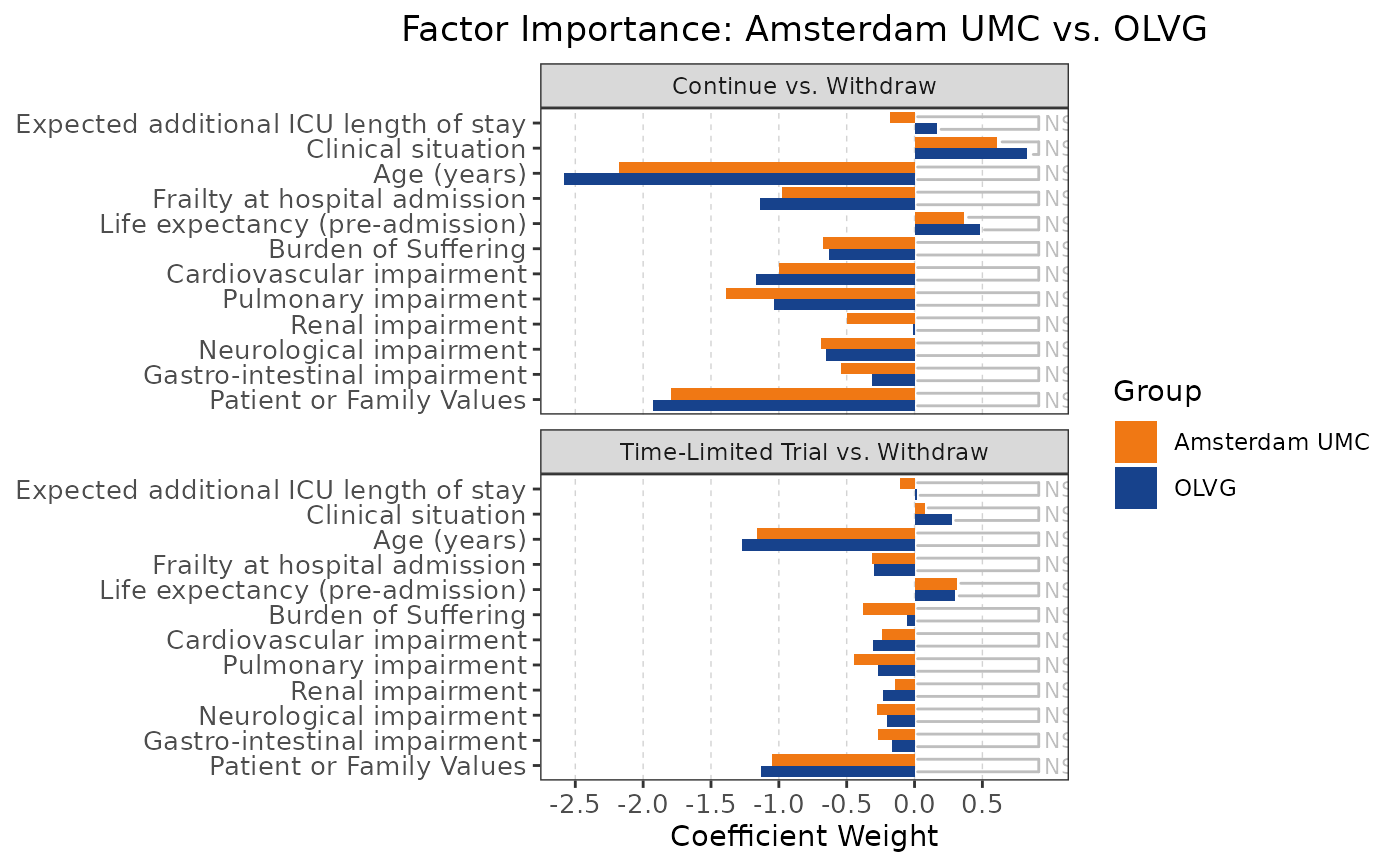
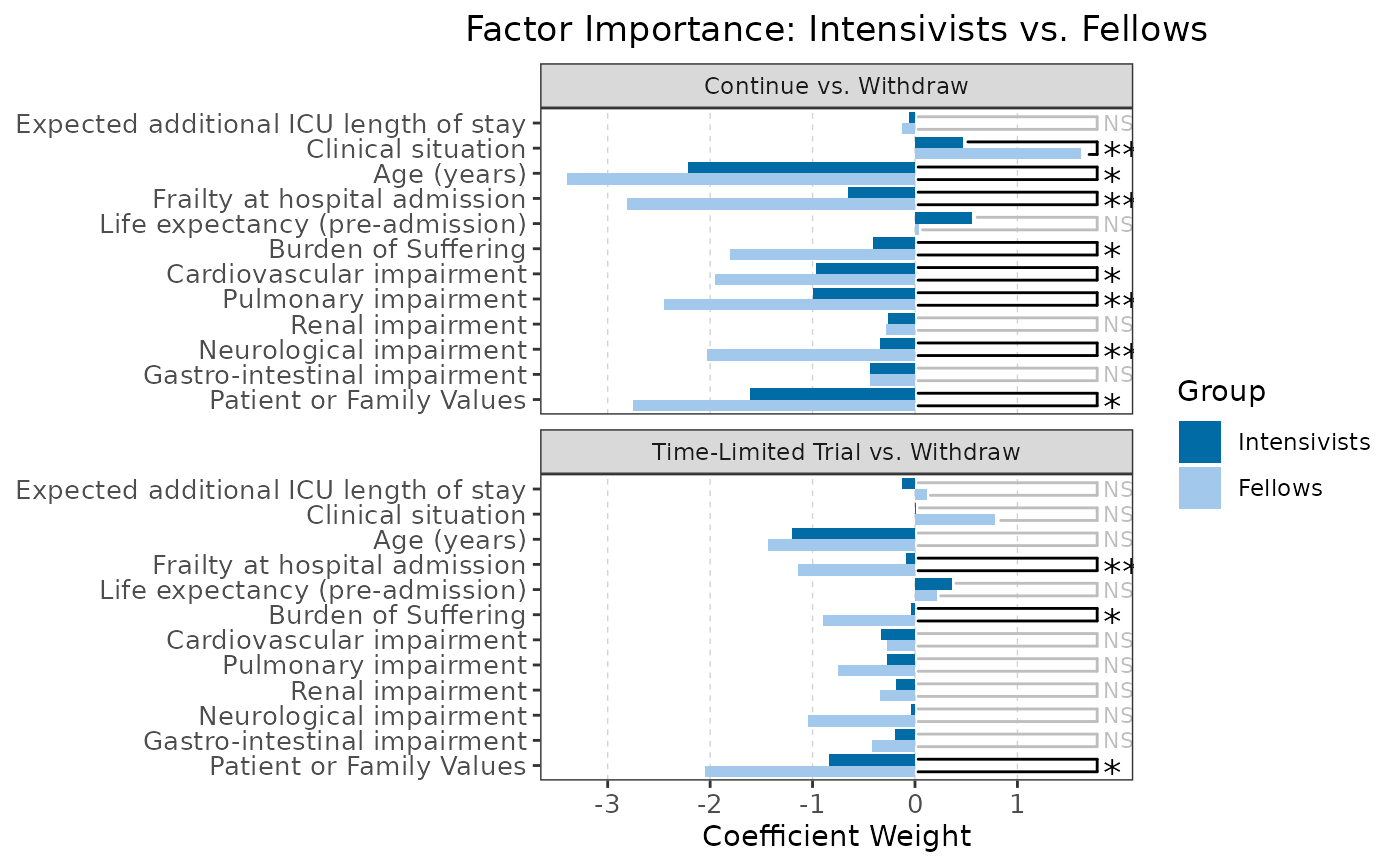
plot_group_comparison.RdCreates plots with coefficients weights and significance levels comparing both groups using the Wald test.
Saves the plots as png and svg in the extdata\figures folder.
Examples
baitlist::plot_group_comparison()
#> Comparing: Amsterdam UMC vs. OLVG
#> Comparing: Intensivists vs. Fellows
#> Comparing: Amsterdam UMC vs. OLVG
#> Comparing: Intensivists vs. Fellows
#> $binary
#> $binary$aumc_olvg
 #>
#> $binary$intensivists_fellows
#>
#> $binary$intensivists_fellows
 #>
#>
#> $multinomial
#> $multinomial$aumc_olvg
#>
#>
#> $multinomial
#> $multinomial$aumc_olvg
 #>
#> $multinomial$intensivists_fellows
#>
#> $multinomial$intensivists_fellows
 #>
#>
#>
#>